I’ve never been shy about it – I love getting into the reporting details of Google Analytics, Facebook Insights, Google AdWords…pretty much any nice analytical tool with a lot data.
Marketing results are often long-term or difficult to tie to dollar figures, so hard data that’s trackable on a daily basis can be like gold. With that in mind, here are a few aspects of Google Analytics that I think firms in the Architecture, Engineering and Construction industry would benefit from if they took a closer look.
Click Patterns – In-Page Analytics
This feature has been in “Beta” for at least a year now – but that doesn’t mean it’s not incredibly useful. When you’re looking at your website from an Information Architecture or usability point of view, this tool is awesome. It basically allows you to click through your entire site and see which links visitors are clicking on every individual page, as a percentage of total clicks and by total number of clicks.
This has endless applications, such as when you want to determine if your content is organized well, if you have the right content, if people are filtering down through your portfolio, etc. Beta or not, this feature gives you a lot of information on how people navigate your website.
Top Keywords
I have yet to work with a client that didn’t want to talk about SEO, at least a little bit. “How do we drive more organic traffic to our website?” Well, even though SEO is a very technical gig, the roots of it are marketing and messaging strategy, plain and simple. Before you can drive increased organic traffic to your site, you have to be focused on what kind of traffic you want – and that means focusing your portfolio, your web content, your message…pretty much everything.
Effective SEO will obviously drive higher organic search engine traffic, but an even better indicator of the kind of traffic your firm gets is the Keywords section. The majority of firms I work with start out with at least 8-10 of their top 10 keywords being some variation of the firm’s name. You can therefore make the assumption that the vast majority of people coming to your site already know you. That’s not always a bad thing, but if you want your website to become a lead generation tool, then you can be certain that’s not doing it. Launching significant marketing efforts (SEO, Social Media, etc.) should begin to change the keywords that show up in that shortlist. For example, you would start to see “health care architects northern Virginia” instead of “Denby Architects”.
Traffic Sources
In my opinion, the Traffic Sources section is often overlooked. It is very important to determine where traffic is coming from beyond the simple breakdown that is displayed on the Dashboard. In general, the Dashboard shows three segments in a pie chart; Search Engines, Direct Traffic and Referring Sites. If you run a good campaign through MailChimp or another email provider, you might have a fourth.
However, going into the Traffic Sources detail can be eye-opening, especially if you are active in Social Media or pay for your firm to be listed in online directories. In fact, if you ARE paying to have your firm listed, this one area may be the single-most important factor for determining whether or not it’s worth paying next year!
Filters
Applying Filters to your Google Analytics account is all about making your life easier from the reporting side of things. There are a couple key reasons to use filters.
The first reason: At least some percentage of your staff has your firm’s website set as their homepage – it’s a given. There isn’t really much reason to do that these days, but I guess people see it as a brand building or loyalty thing. Those visits (every time they open their browser window during the day) falsely inflate your traffic, increase your bounce rate, decrease your average time on site and decrease your percentage of new visits – just to name a few. Use an “exclude” filter to cut out traffic from your office’s IP address.
The second reason: Filters, combined with adding profiles, can easily help you pull reports on specific sections of your site. Want to know how much traffic your portfolio is getting? Have a blog integrated into your site and want to see a report on JUST the blog? Using “include” filters will help you look at these reports with minimal clicks and you can set up automatic emails or exports as well.
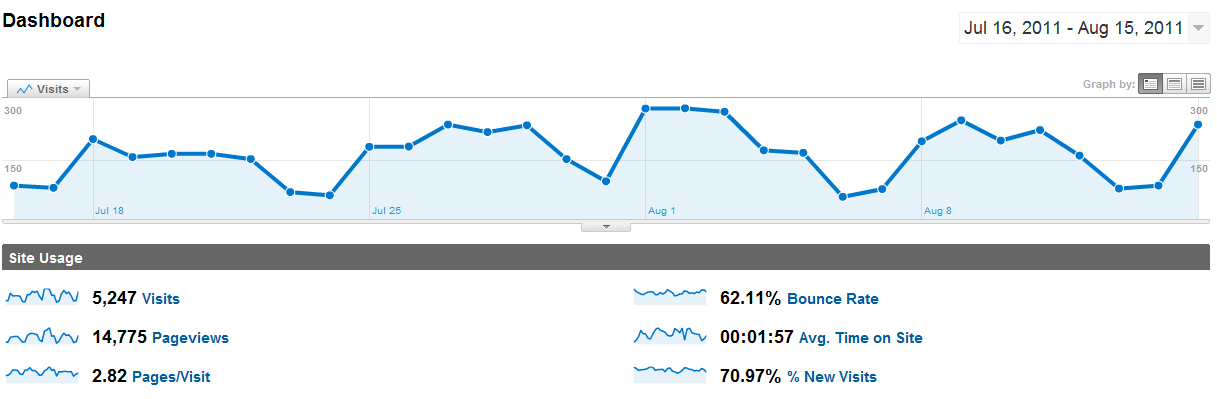
Dates
A simple one, but a good one. Google Analytics’ default setting shows you the traffic for the most recent month. Additionally, it shows you a percentage change upon first logging in. However, your analysis shouldn’t stop there. There are a few ways to slice date-to-date comparisons.
This month compared to last month – Very useful, but for any professional services firm, marketing results will rarely show immediate impact from one month to the next. Email marketing is one exception to that rule, but most other campaign tactics are going to have a more long-term impact.
This month compared to the same month last year – Absolutely a worthwhile comparison to make for firms working in the public sector (end of fiscal year spikes), and for firms that run regular campaigns, promotions or events around the same time every year.
The most recent 6 months compared to the last 6 months – Again, given the longer lead time of many marketing efforts in the built environment, this snapshot is more useful than a month to month comparison in my opinion. Is our firm showing growth, increased traffic, better keywords, etc. than we were 6 months ago? That’s a stat to hang your hat on and include in a marketing report to the principals.